Solving the Structure
-
Click on the
Worktab in the GUI panel. Like all active GUI elements, it changes colour and becomes orange. -
Click on the arrow next to the
Solvebutton so that it turns orange and points upwards. The structure solution options are displayed. -
Select a solution program from the drop-down menu. Depending on your computer setup, you may only see the built-in olex2.solve solution program. If you have other structure solution programs installed, you may see those listed here as well. In recent year, George Sheldrick’s excellend program ShelXT has established itself as a very good default choice for successful structure solution.
-
Click Solve (or type
>>solve) and Olex2 attempts to solve the structure. If this is successful, electron density peaks (Q-Peaks) are displayed as brown spheres. Hover over these to see their peak height, or look atInfo|Electron-Density-Peaksfor a click-able list of the top 10 peaks. The colour intensity of these Q-peaks represents the relative peak height. The molecule of sucrose should be clearly visible, along with some much weaker, artificial peaks.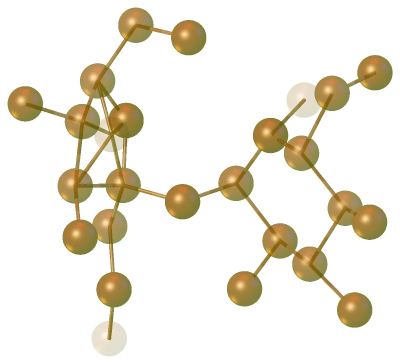
Sucrose Q-Peaks. You can easily recognise the structure from the position of the electron density peaks. Q-peaks represent maxima in the electron density map i.e. places where the atoms are likely to be located. If the structure solution has been successful, you can probably see the whole molecule, but this is not always the case: sometimes you can only make out parts of the molecule, and these might be fragmented. The intensity of the spheres scales to the largest peak present and the weakest peaks appear faded. You can adjust the scaling in
Info|Electron-Density-Peaks. -
In the
Worksection, there is another header tabToolbox-Work. Select Q-Peak Intensities from the Labels menu. A label next to the Q-peaks displays the relative peak height. In a nearly finished structure, these numbers are close to the number of electrons present per cubic Å. If – like here – not many atoms have been assigned yet, the numbers are based on an arbitrary scale.The Q-peak names also indicate the relative intensity order i.e. the most intense peak is Q1 with Q2, Q3, Q4 … becoming weaker. Select Labels On/Off from the drop-down menu in
Work|Toolbox-Work|Labels(or press F3). At this stage, it is normally more useful to see their relative intensities. -
Still in the
Toolbox-Workclick on the Q icon to toggle between Q-peaks, Q-peaks with bonds and No Q-peaks (Or press CTRL+Q repeatedly). Some of the Q-peaks may not represent real atoms at this stage so do not worry if there are unexpected bonds.
Since X-rays are diffracted by the electrons surrounding atomic nuclei, the larger Q-peaks relate to heavier atoms.
-
The “structure” can be rotated by holding down the LEFT MOUSE button in the background of the main screen and moving the mouse.
-
The next stage is to assign atom types to the Q-peaks. Use the LEFT MOUSE button to click on Q-peaks that you believe correspond to a particular atom type (e.g. oxygen). Selected atoms turn green.
If the Q-peaks do not appear to form a sensible structure, try typing
>>compaq -a, which pulls Q-peaks together. Clicking on the centre button S (top right of GUI) has the same effect.
 -
In
Toolbox-Workclick on the appropriate atom type e.g. O. These Q-peaks change colour depending on which atom they represent. Carry on assigning as many Q-peaks as possible; it should be possible to find all C and O atoms at this stage (although this is not always the case for every crystal structure). With peaks (or atoms) selected, you can also type>>name Cto assign all selected peaks (or atoms) as carbon atoms. By using the UP key, it is easy to repeat this command.Hovering over the atom with the mouse pointer shows the atom label e.g. O1, which takes the format of an atom type followed by a number. There are often some artificial peaks at this stage, so identify recognisable fragments rather than trying to assign an atom type to every Q-peak. Hydrogen atoms are not usually identified at this point since they have a very low scattering power.